Tufts University · Department of Civil & Environmental Engineering
Transportation Research Board (TRB) · Tufts University
01 / Introduction
As climate change intensifies flood risk across the United States, transportation agencies face increasing pressure to allocate limited infrastructure funding wisely. The data they use to make those decisions—flood hazard maps—can dramatically shape which communities and roadways are prioritized for investment.
Massachusetts continues to rely primarily on FEMA's National Flood Hazard Layer (NFHL), a watershed-scale model that, while widely adopted, was not designed for fine-grained infrastructure analysis. Newer models like the First Street Flood Model (FS-FM) offer parcel-level resolution and broader statewide coverage—but remain underutilized in practice.
This study asks a fundamental question: Does it matter which flood model you use? By comparing FEMA and FS-FM vulnerability rankings for every MassDOT roadway segment in the state, we show that the answer is a clear yes—with major implications for equity and resource allocation.
02 / Data & Methods
The federal standard for flood zone mapping. Based on watershed-scale hydrological modeling, FEMA's polygons define broad flood zones (A, AE, VE, X, D) tied to 1-in-100-year return periods. Its coarse resolution can overestimate flood extents across entire neighborhoods rather than identifying specific at-risk segments.
A high-resolution, parcel-level flood model developed by First Street Foundation. FS-FM provides expected inundation depths on a continuous scale rather than binary zones, and offers broader geographic coverage including areas FEMA has not yet mapped. Tiles were extracted and merged from Zillow's climate-risk mapping interface.
MassDOT roadway centerlines were divided into one-mile segments, each buffered by lane width. These segments were then intersected with both flood models to calculate average inundation depth. Both datasets were standardized to a 0–5 flood-risk scale using the table below, enabling direct comparison.
| FEMA Zone | FS-FM Depth | Rank |
|---|---|---|
| A, AH, AO, VE, AE High Flood Hazard (>1 ft) |
≥ 3 ft | 5 |
| — | 2 ft ≤ x < 3 ft | 4 |
| D Moderate Flood Hazard (~1 ft) |
1 ft ≤ x < 2 ft | 3 |
| — | 0.5 ft ≤ x < 1 ft | 2 |
| X Low Flood Hazard (<1 ft) |
x < 0.5 ft | 1 |
| Not within flood zone | Outside FS-FM | 0 |
Flood risk ranking table used to standardize FEMA and FS-FM data to a common 0–5 scale.
03 / Calculating Vulnerability
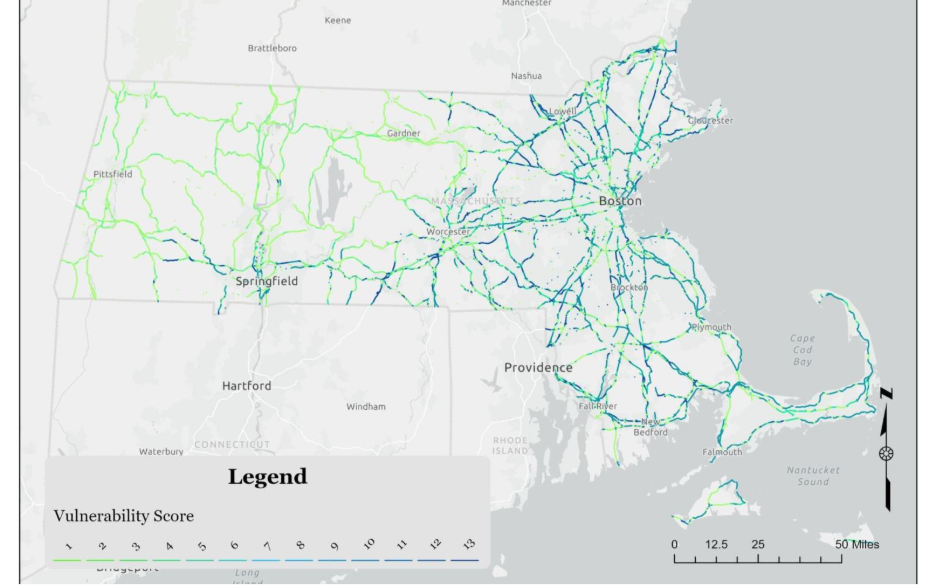
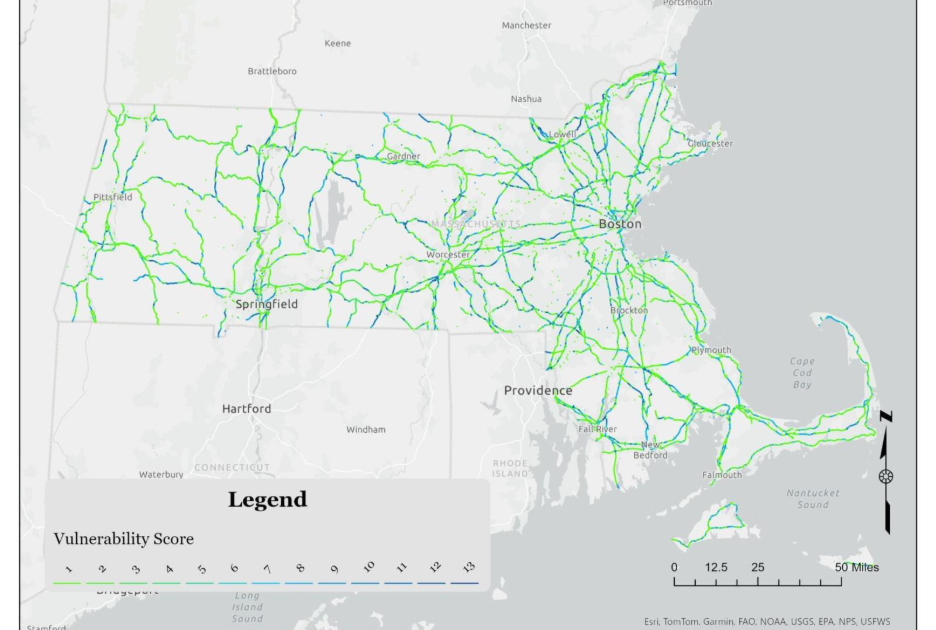
Flood depth alone does not capture full infrastructure risk. The vulnerability ranking integrates three factors—flood risk, culvert condition, and bridge presence—each weighted by a sensitivity analysis.
The flood risk variable received a coefficient of 2, reflecting its outsized influence on overall vulnerability as determined through sensitivity analysis. Culvert vulnerability was assessed using the ratio of bankfull width to culvert width, with each culvert assigned a 0.5-mile buffer intersected against roadway segments. A value of 1 was subtracted when a bridge was present, serving as a surrogate for an elevated roadway.
04 / Results
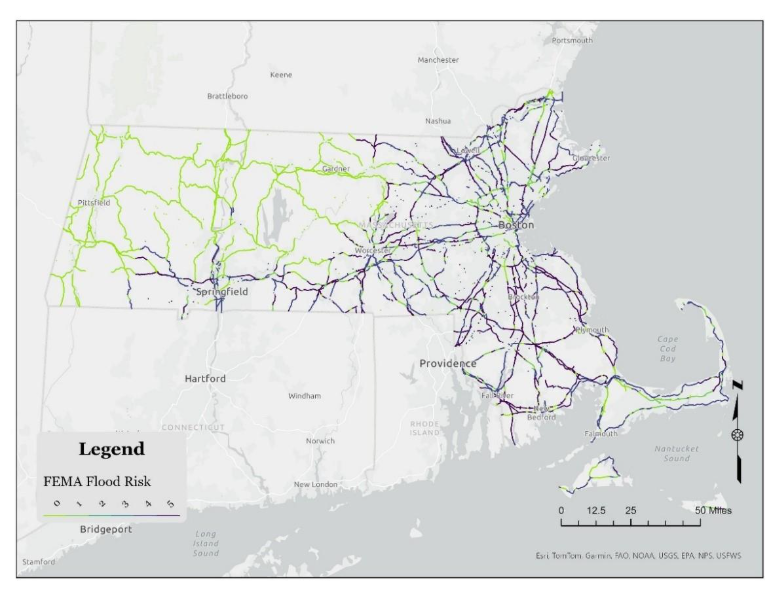
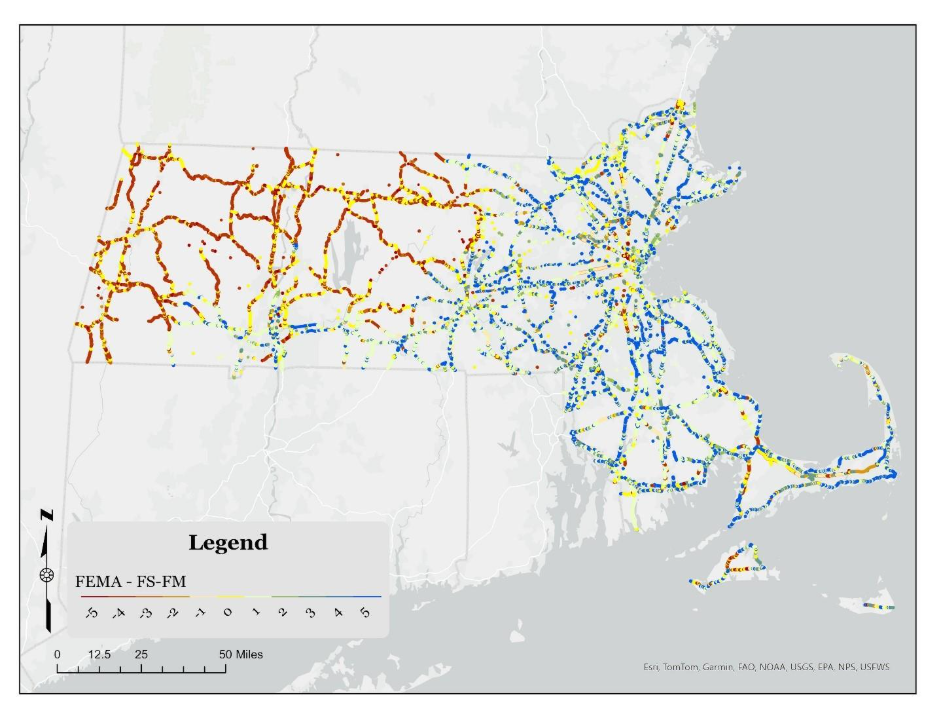
After mapping flood model outputs onto the full MassDOT road network, the statewide results reveal striking differences between the two approaches. FEMA identifies roadways in eastern and southern Massachusetts as most flood-prone, with minimal risk assigned to the northwest—likely reflecting its limited coverage in that region and its watershed-based methodology.
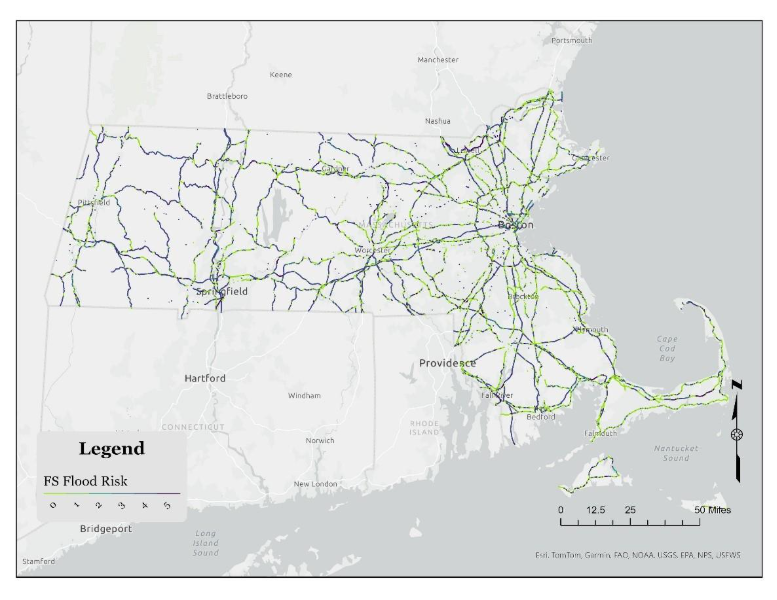
In contrast, FS-FM produces more geographically varied results statewide, reflecting its broader parcel-level modeling and wider coverage area.
Key finding: FEMA labels 41% of roadway segments as high-risk that FS-FM assigns no risk. This level of disagreement means that investment decisions made under one model could be systematically different—and potentially inequitable—compared to those made under the other.
05 / Ground Truth Example
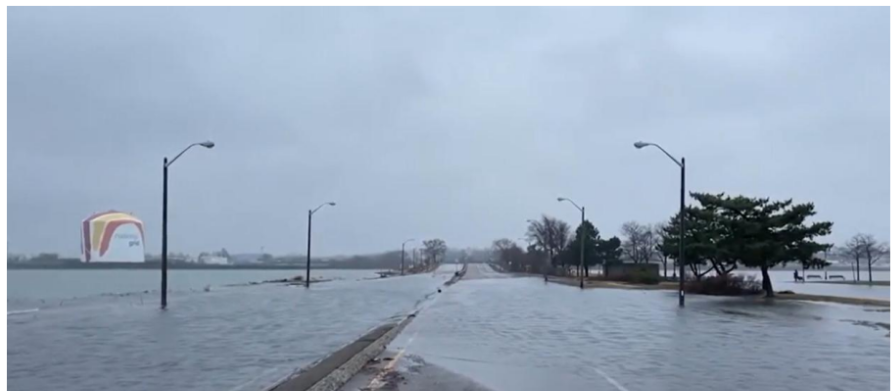
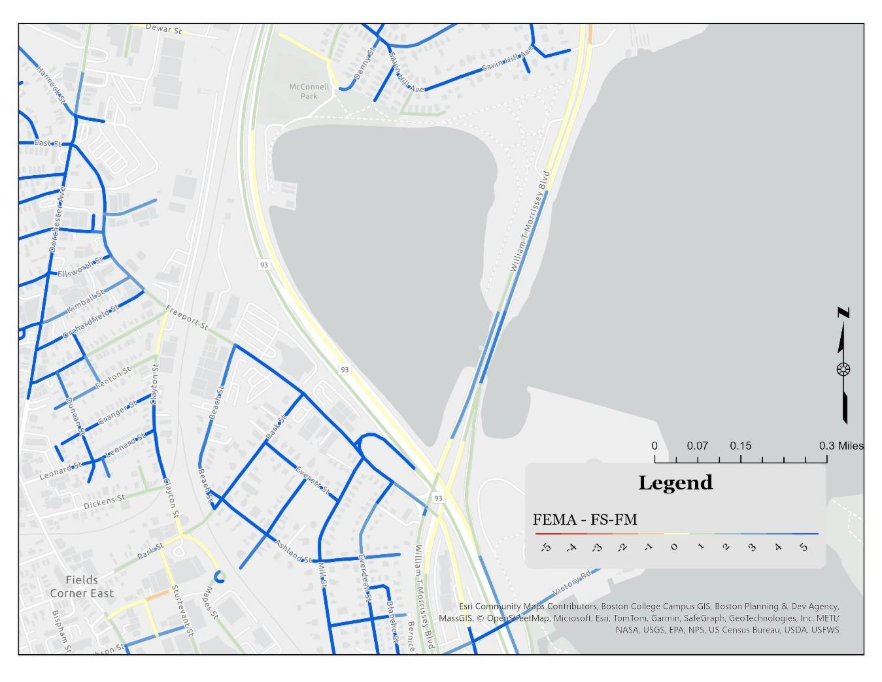
To ground these statewide findings in real-world conditions, we examined Morrissey Boulevard in Boston—a well-documented flood-prone corridor where real events allow us to test model accuracy. During king tide and storm events, specific low-lying roadway segments along Morrissey repeatedly flood, even while the adjacent bridge structure remains largely unaffected.
This example illustrates a key limitation of FEMA's coarser polygon approach: it tends to apply flood risk to entire zones, which can include the bridge structure in the same high-risk category as the vulnerable roadway segments beside it.
FS-FM's higher resolution allows it to pinpoint the vulnerable low-lying segments more precisely, separating them from elevated structures that are not meaningfully at risk during typical flood events.
At the same time, FS-FM can underpredict flood extent in certain areas—meaning neither model alone is sufficient. The Morrissey case illustrates why combining both datasets yields the most accurate picture of true vulnerability.
MassDOT's ongoing Morrissey Boulevard redesign—released for public comment in March 2025—underscores the practical stakes of this analysis for real infrastructure investment decisions.
06 / Conclusion
FEMA's coarse polygon model often overpredicts flood risk at the segment level. FS-FM can underpredict in certain areas. Neither model alone is sufficient for equitable infrastructure prioritization.
Where both models agree on high-risk segments, agencies can prioritize interventions with greater confidence. These areas of convergence provide actionable starting points for investment.
The 41% discrepancy in high-risk classifications underscores the urgent need for publicly accessible, high-resolution flood data and clear documentation of which models inform funding decisions.
These findings underscore the need for publicly accessible, high-resolution flood data and improved modeling approaches that integrate both datasets to strengthen accuracy, equity, and long-term climate resilience planning. Transparency about model choice is not a technical footnote—it is a matter of environmental justice.
References & Acknowledgements